
- October is the wettest month of the year in Porto. 183 mm across 13 wet days, more than November and more than December.
- And it is one of the two months people search for most, neck and neck with April and well ahead of the rest.
- September is the month to ask about instead. 6 wet days, 24 dry ones, 23.5 degrees and 10.8 hours of sun a day.
- July and August average 3 days of rain each. Porto's reputation for rain is earned in winter, not in summer.
- The average is the wrong number to plan on. March has run from 4 wet days to 26 across the ten years measured.
- This is climate, not a forecast. Ten years of daily records, not what will happen on your week.
Wettest month
October, 183 mm
Driest
July, 13 mm
Best all round
September
September rain
6 days, 24 dry
October rain
13 days
Widest swing
March, 4 to 26 days
Years measured
10
The standard advice for Portugal is to go in spring or early autumn, when it is neither too hot nor too wet. For most of the country that is right. For Porto, half of it is wrong, and the half that is wrong happens to be the month people ask about most.
So rather than repeat the seasons, we counted them: 3,653 days of observations, ten full years, every day's rainfall, temperature and sunshine. What follows is what the numbers say, month by month, including the one figure that decides a trip and that none of the pages ranking for this search publishes.
The twelve months
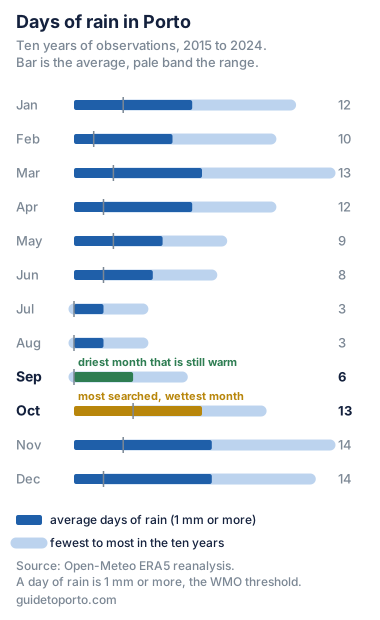
| Month | High | Low | Wet days | Range | Rain | Sun a day |
|---|---|---|---|---|---|---|
| January | 13.5 C | 7.1 C | 12 | 5 to 22 | 162 mm | 6.6 h |
| February | 14.7 C | 7.9 C | 10 | 2 to 20 | 120 mm | 7.9 h |
| March | 15.8 C | 8.6 C | 13 | 4 to 26 | 146 mm | 9 h |
| April | 17.8 C | 10.5 C | 12 | 3 to 20 | 135 mm | 10.7 h |
| May | 20.2 C | 12.9 C | 9 | 4 to 15 | 85 mm | 11.8 h |
| June | 21.8 C | 14.8 C | 8 | 3 to 14 | 50 mm | 13 h |
| July | 24.4 C | 16.6 C | 3 | 0 to 7 | 13 mm | 13.4 h |
| August | 24.7 C | 16.6 C | 3 | 0 to 7 | 14 mm | 12.1 h |
| September | 23.5 C | 15.6 C | 6 | 0 to 11 | 68 mm | 10.8 h |
| October | 20.7 C | 13.9 C | 13 | 6 to 19 | 183 mm | 8.1 h |
| November | 16.6 C | 10.7 C | 14 | 5 to 26 | 167 mm | 6.8 h |
| December | 14.7 C | 8.8 C | 14 | 3 to 24 | 182 mm | 6.4 h |
Ten years of daily observations, 2015 to 2024, from the Open-Meteo archive of the ERA5 reanalysis. A wet day is one with 1 mm of rain or more. Range is the fewest and the most wet days that month recorded in any of the ten years.
October is the wettest month of the year
183 mm across 13 wet days. Not the second wettest, not one of the wetter ones: the wettest month of the twelve, ahead of December at 182 mm and November at 167.
That is worth stating plainly because October is one of the two months people search for most when planning a trip to Porto, narrowly ahead of April and with roughly four times the searches of March and three times those of July. The two months that draw the most planning attention, October and April, average 13 and 12 wet days. The two driest months, July and August, draw about a third as much.
This is not an argument against going. Eighteen days of October are dry, the city is far quieter than in August, the light on the river is at its best and the wine harvest has just finished upstream. If you go in October and get a good week, it is arguably the finest month to be there. The point is narrower: if you picked October because you read that autumn is the dry shoulder season, you picked it on a fact that is not true of this city, and you should pack for that.
September is the month to ask about
One month earlier, almost everything is better.
| September | October | |
|---|---|---|
| Wet days | 6 | 13 |
| Dry days | 24 | 18 |
| Rain | 68 mm | 183 mm |
| Daytime high | 23.5 C | 20.7 C |
| Sun a day | 10.8 h | 8.1 h |
Same ten year series.
Less than half the wet days, a third of the rain, three degrees warmer and two and a half more hours of sun. September is the month where Porto's summer has not ended but its crowds have, and it gets about forty per cent fewer searches than October despite being the better month on every column in the table above.
It is also still warm enough for the coast, which matters more here than in most cities because the beaches are inside the metro network. The water is another question entirely, and we measured it in the guide to the beaches of Porto: the Atlantic off this coast stays cold all year.
The average is the wrong number
Every page about this subject, including this one, will tell you that March averages 13 days of rain. Here is what that average is made of, across the ten years measured:
- March has ranged from 4 wet days to 26. A swing of three weeks.
- November from 5 to 26.
- December from 3 to 24.
- July from 0 to 7, which is the point: summer is not just drier, it is far more predictable.
That last contrast is the useful one. Choosing July buys you a narrow range as well as a low one, so the month behaves the way the average says it will. Choosing March buys you a coin toss that the average completely hides. Two travellers who both went to Porto in March, in different years, could reasonably come back with opposite descriptions of the weather, and both would be right.
None of the six pages ranking for this search publishes that range. It is the figure that should drive the decision and it is the one nobody shows.
What counts as a day of rain
Sources disagree about Porto's rain partly because they are not counting the same thing. A day with a two minute drizzle at seven in the morning can be counted as a day of rain or not, depending on the threshold.
Everything on this page uses 1 mm or more, which is the World Meteorological Organization threshold. Here is what happens if you count any measurable drop instead:
| Month | 1 mm or more | Any measurable rain |
|---|---|---|
| July | 3 | 6 |
| August | 3 | 5 |
| June | 8 | 12 |
| September | 6 | 8 |
| October | 13 | 16 |
| November | 14 | 16 |
Same series, counted at both thresholds.
In July the count doubles, from 3 to 6. In November it barely moves, from 14 to 16. So the summer is where the choice of threshold changes the story: a source that counts every drop will tell you July has rain on one day in five, and it is not lying, it is counting drizzle that would not stop you doing anything.
If a page tells you Porto has 150 rainy days a year without saying what a rainy day is, that number cannot be compared with any other number.
Advice about Portugal is not advice about Porto
The pages ranking for this search are not careless, but several of them are answering a different question. One of the six, on the first page of results, recommends spring and early autumn as the times that are not too hot and not too rainy, and names March to May and September to October.
That is sound advice about Portugal and poor advice about Porto. Its own page is titled for the country, and for the Algarve or Lisbon it holds up. In Porto, March and October are two of the four wettest months of the year. The country is not one climate: this is the wet corner of it.
Credit where it is due: the one competitor that is specifically about Porto gets it right, recommending late spring and September. That matches the data exactly. May, June and September are the three months where warmth and dryness overlap here.
July and August, and what you trade for them
On weather alone the summer wins and it is not close. Three days of rain, 28 dry days, 13.4 hours of sunshine a day in July, and highs around 24.5 degrees that are warm without being the furnace of inland Spain or the Algarve.
What you trade is everything else. The queues at Livraria Lello are at their worst, the cellars in Gaia run their tours at capacity, and the day trips that involve a coach are fullest. None of that is measured on this page, and it is the honest limit of a weather based recommendation: the best weather and the best trip are not necessarily the same month.
Winter, which is milder than people expect
January averages a high of 13.5 degrees and a low of 7.1. That is milder than London, Paris or Amsterdam, and hard frost is rare. Nobody should be picturing a northern winter.
What winter actually brings is grey. 6.4 to 6.8 hours of sunshine a day against 13.4 in July, and rain on 12 to 14 days a month. December carries 182 mm, within a millimetre of October. If your trip is indoors heavy, the cellars, the bookshop, the Bolsa, the food, winter is genuinely underrated and much cheaper. If you came to walk the riverfront, it is a gamble.
What this page does not tell you
This is climate, not weather. Ten years of what usually happens, which is a different thing from what will happen while you are there. And specifically:
- No forecast. For your actual dates, use a forecasting service. This page cannot and does not try to do that.
- No prices and no crowd figures. Both move by month and both matter as much as rain. We have not measured either, so we have not claimed anything about them beyond the obvious.
- No sea temperature by month. The beaches guide has the figure we measured, but not a monthly series.
- One location. These are the coordinates of central Porto. The Douro valley upstream is hotter in summer and the coast is windier.
How this was counted
The source is the Open-Meteo archive of the ERA5 reanalysis, a Copernicus dataset, queried on 23 September 2026 for the coordinates of central Porto. It is open and needs no key. The series runs from 1 January 2015 to 31 December 2024: 3,653 days, ten complete years.
For each month the script groups the ten Januaries, the ten Februaries and so on, computes the figures separately for each year and then averages those, which is what makes the range column possible. A wet day is a day with at least 1 mm of rain. Sunshine is the daily mean of measured sunshine duration.
Ten years is a deliberate choice rather than a convenient one. One year describes the weather that year, not the climate. Thirty would be more standard for climatology but would reach back to a measurably cooler decade, which is the wrong answer to the question people are actually asking, which is what to expect now.
The competing pages were measured before any of this was written: 290 to 3,333 words, and not one of the six carries a table or publishes the year to year range.
Questions
What is the best time to visit Porto?
September, on the numbers. It averages 6 days of rain against 13 in October, keeps a daytime high of 23.5 degrees, and gives 10.8 hours of sunshine a day. May and June are the next best, at 9 and 8 wet days. Those three are the months where warm weather and low rainfall actually overlap in Porto, measured over ten years of daily observations.
Is October a good time to visit Porto?
October is the wettest month of the year in Porto: 183 mm of rain across 13 wet days on average, more than December and more than November. It is also the month people search for most. That does not make it a bad trip, because 18 days of the month are still dry and the city is quieter than in summer, but if you are picking October because you read that autumn is the dry shoulder season, that advice was written about Portugal as a whole and does not describe Porto.
How much does it rain in Porto?
It depends enormously on the month. July and August average 3 days of rain each, with 13 and 14 mm. October, November and December average 13 to 14 days and 167 to 183 mm. Across the year Porto is genuinely wet by Portuguese standards, but the rain is concentrated: the summer is close to dry and the winter carries almost all of it.
What is the driest month in Porto?
July, with 13 mm of rain spread over about 3 days, and 28 dry days in the month. August is almost identical at 14 mm. Both also deliver the most sunshine, 13.4 and 12.1 hours a day.
Is it cold in Porto in winter?
Not really cold, but wet and dark. January averages a high of 13.5 degrees and a low of 7.1, which is milder than most of northern Europe, and frost is rare. What winter does bring is rain on about 12 to 14 days a month and only 6.4 to 6.8 hours of daylight sunshine, so the issue is grey rather than cold.
How reliable are these monthly averages?
As a description of the climate they are solid, being ten years of daily records. As a prediction for your specific week they are weak, and the page shows why: in the ten years measured, March had as few as 4 days of rain in one year and as many as 26 in another. November ranged from 5 to 26. The average hides a swing of three weeks, so treat the monthly figure as the shape of the month rather than a forecast.
Header photograph: Ribeira from Dom Luis I bridge (4) by Krzysztof Golik, licensed under CC BY-SA 4.0. Cropped to fit.

Written by Diego Fresno, This one is a count rather than a memory. I pulled ten full years of daily observations for central Porto, 3,653 days, and worked out what each month actually does: rain, temperature, sunshine, and how far each month swings from one year to the next. Two things came out of it that I did not expect. October, the month more people search for than any other, is the wettest of the twelve. And September, one month earlier, has less than half the wet days and is three degrees warmer. The range column is the one I would read first: March has gone from 4 wet days to 26 in the space of this series, so the average is a description of the month, not a promise about your week.. Verified quarterly: last review September 2026. About the author →